Where will the water go?
“Terrain decides where water goes long before a drainage plan does. The job is to read the terrain first.”
A drainage and flood risk analysis for a proposed warehouse site near Bangalore. I modelled the terrain from satellite elevation data, worked out where surface water actually collects, and designed a drainage layout that follows the natural slope instead of fighting it.
-
SA
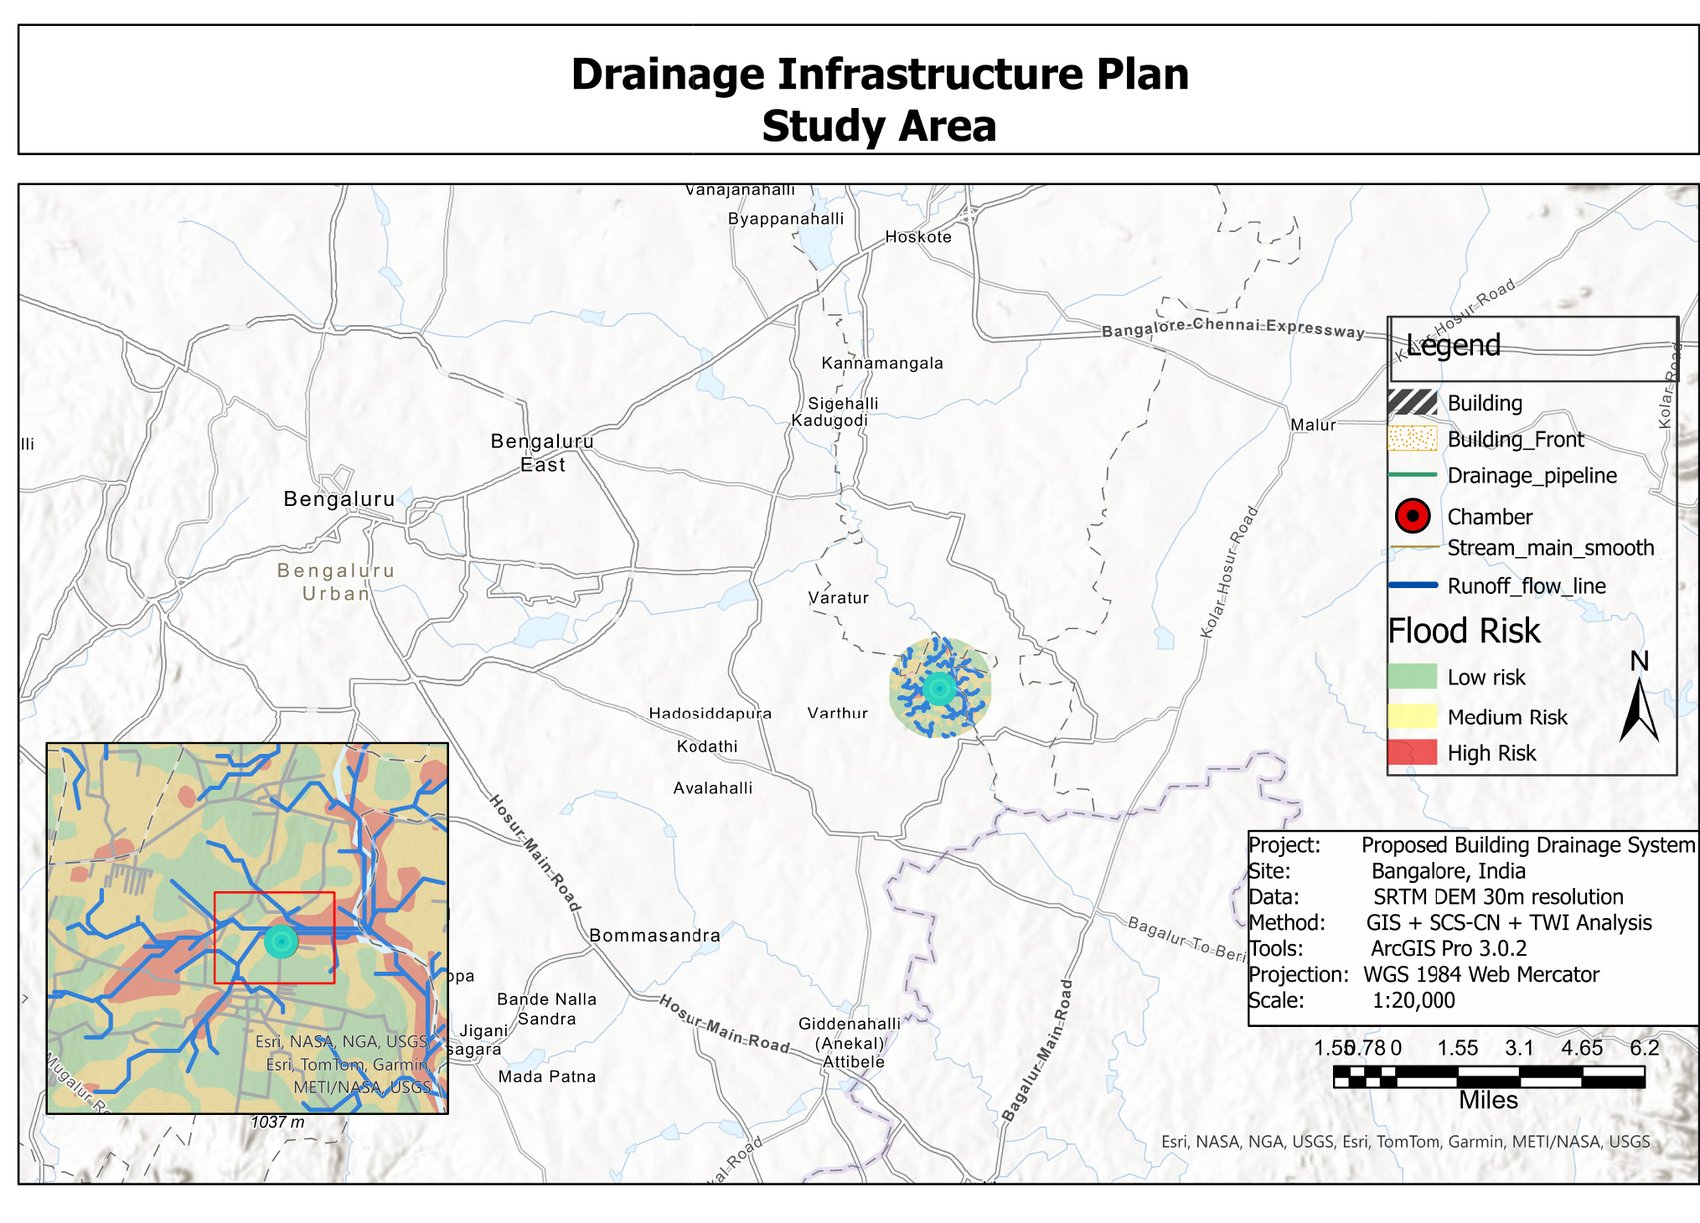
Bangalore, Karnataka, India Maadappanahalli Village Road · scale 1:20,000
-
DEM
SRTM DEM, 30 m resolution WGS 1984 Web Mercator projection
-
M
GIS + SCS-CN + TWI ArcGIS Pro 3.0.2 with Spatial Analyst
Produced for Mitra Cops as a pre-construction drainage assessment.
Plan the drainage before you build
A warehouse was proposed for a site on the outskirts of Bangalore. Before construction, someone needed to answer a straightforward but consequential question: when it rains hard, where does the water go — and does any of it end up against the building?
Terrain drives this. Irregular ground sends runoff in directions that aren’t obvious from a site visit, water concentrates in low-lying pockets, and without structured drainage pathways it pools exactly where you least want it.
Getting this wrong is expensive after the concrete is poured. Getting it right beforehand is mostly a matter of reading the elevation data properly.
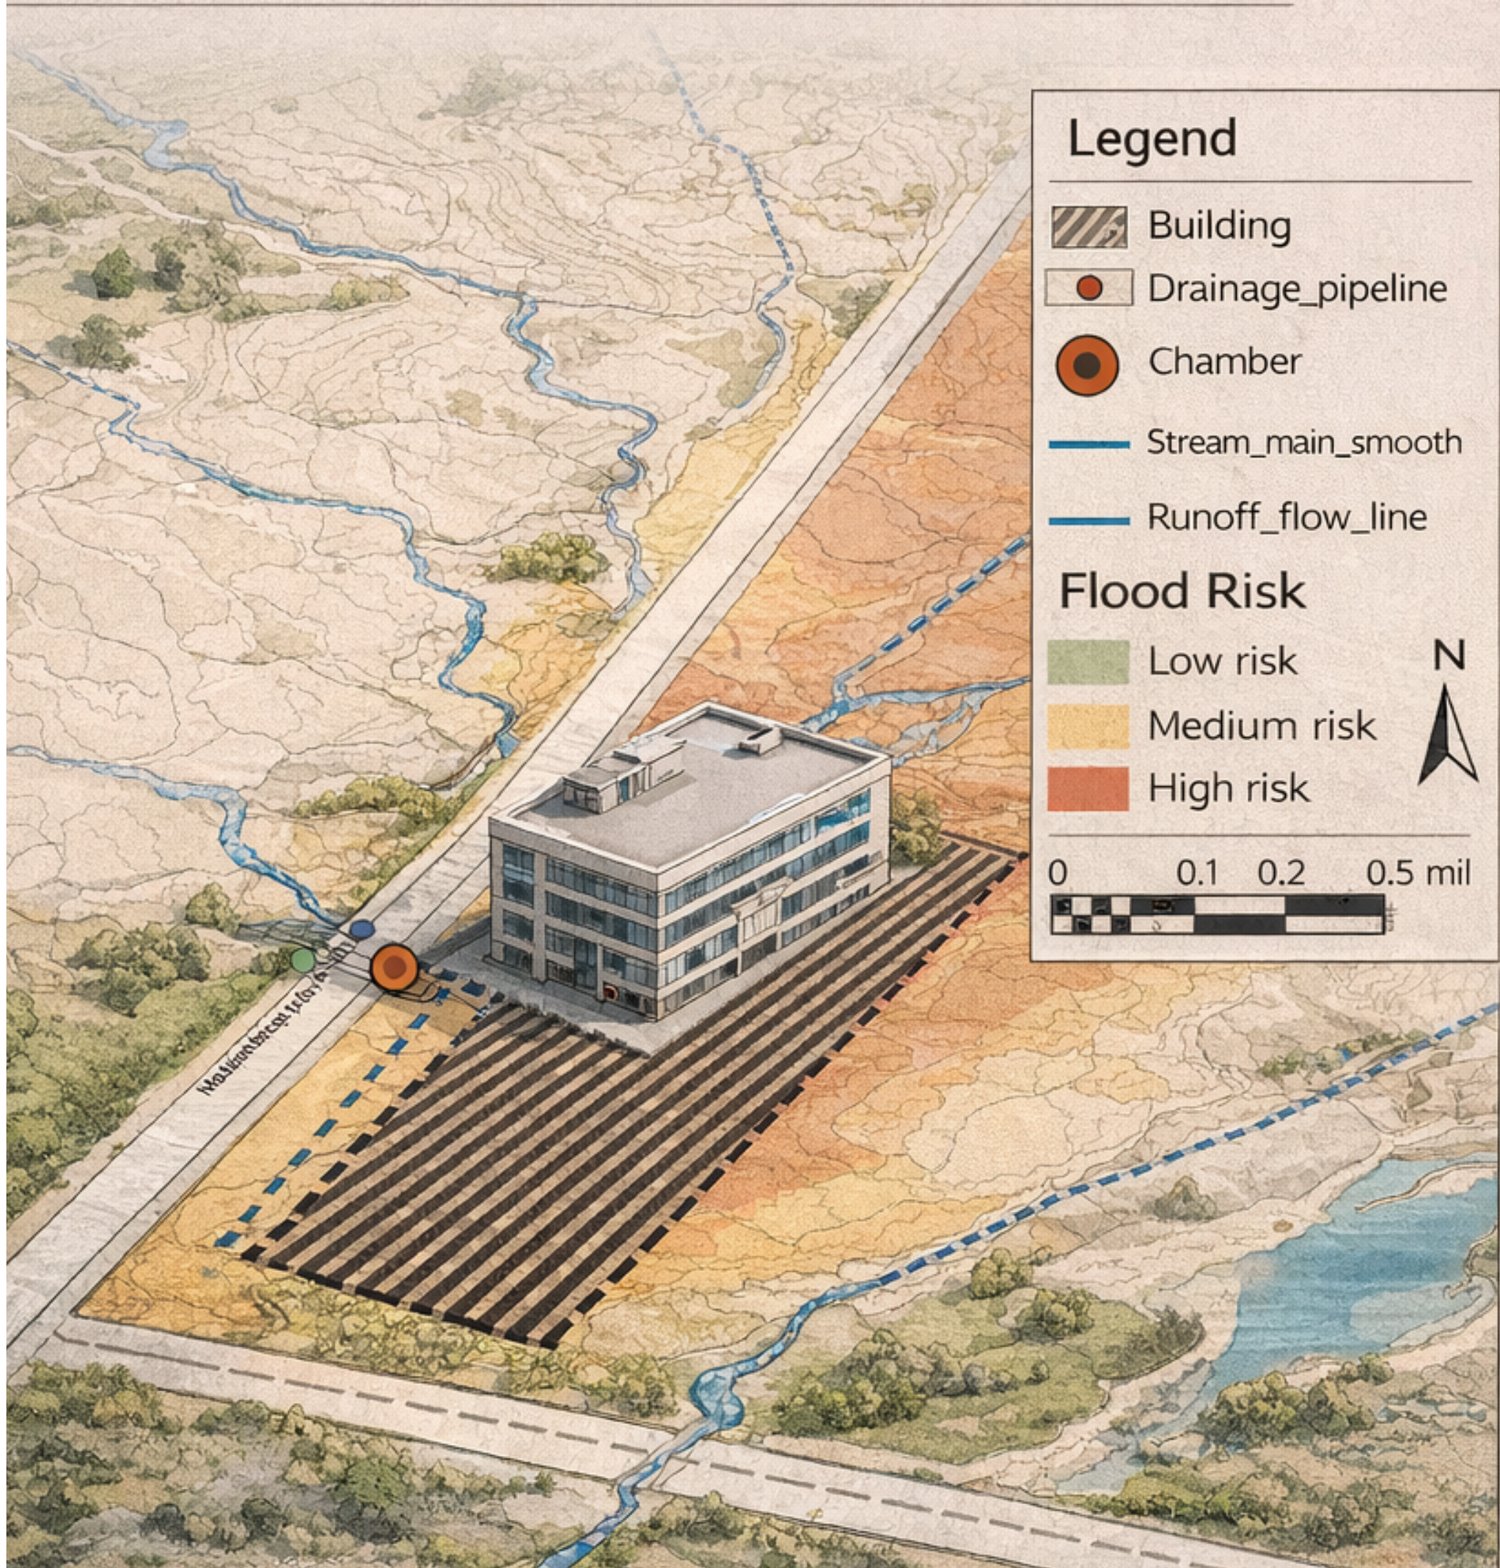
Two models, one answer
SRTM DEM
30 m satellite elevation data processed in ArcGIS Pro to derive slope, flow direction and flow accumulation — the physical skeleton of where water can travel.
SCS-CN
The Soil Conservation Service Curve Number method estimates how much rainfall becomes surface runoff rather than soaking in — a function of soil type and land cover.
TWI
The Topographic Wetness Index combines upslope catchment area with local slope to predict which cells accumulate water. It is what turns a terrain model into a risk map.
Using both SCS-CN and TWI matters: one tells you how much water arrives, the other tells you where it settles. Either alone would give half an answer.
Locating the site
Reading the runoff
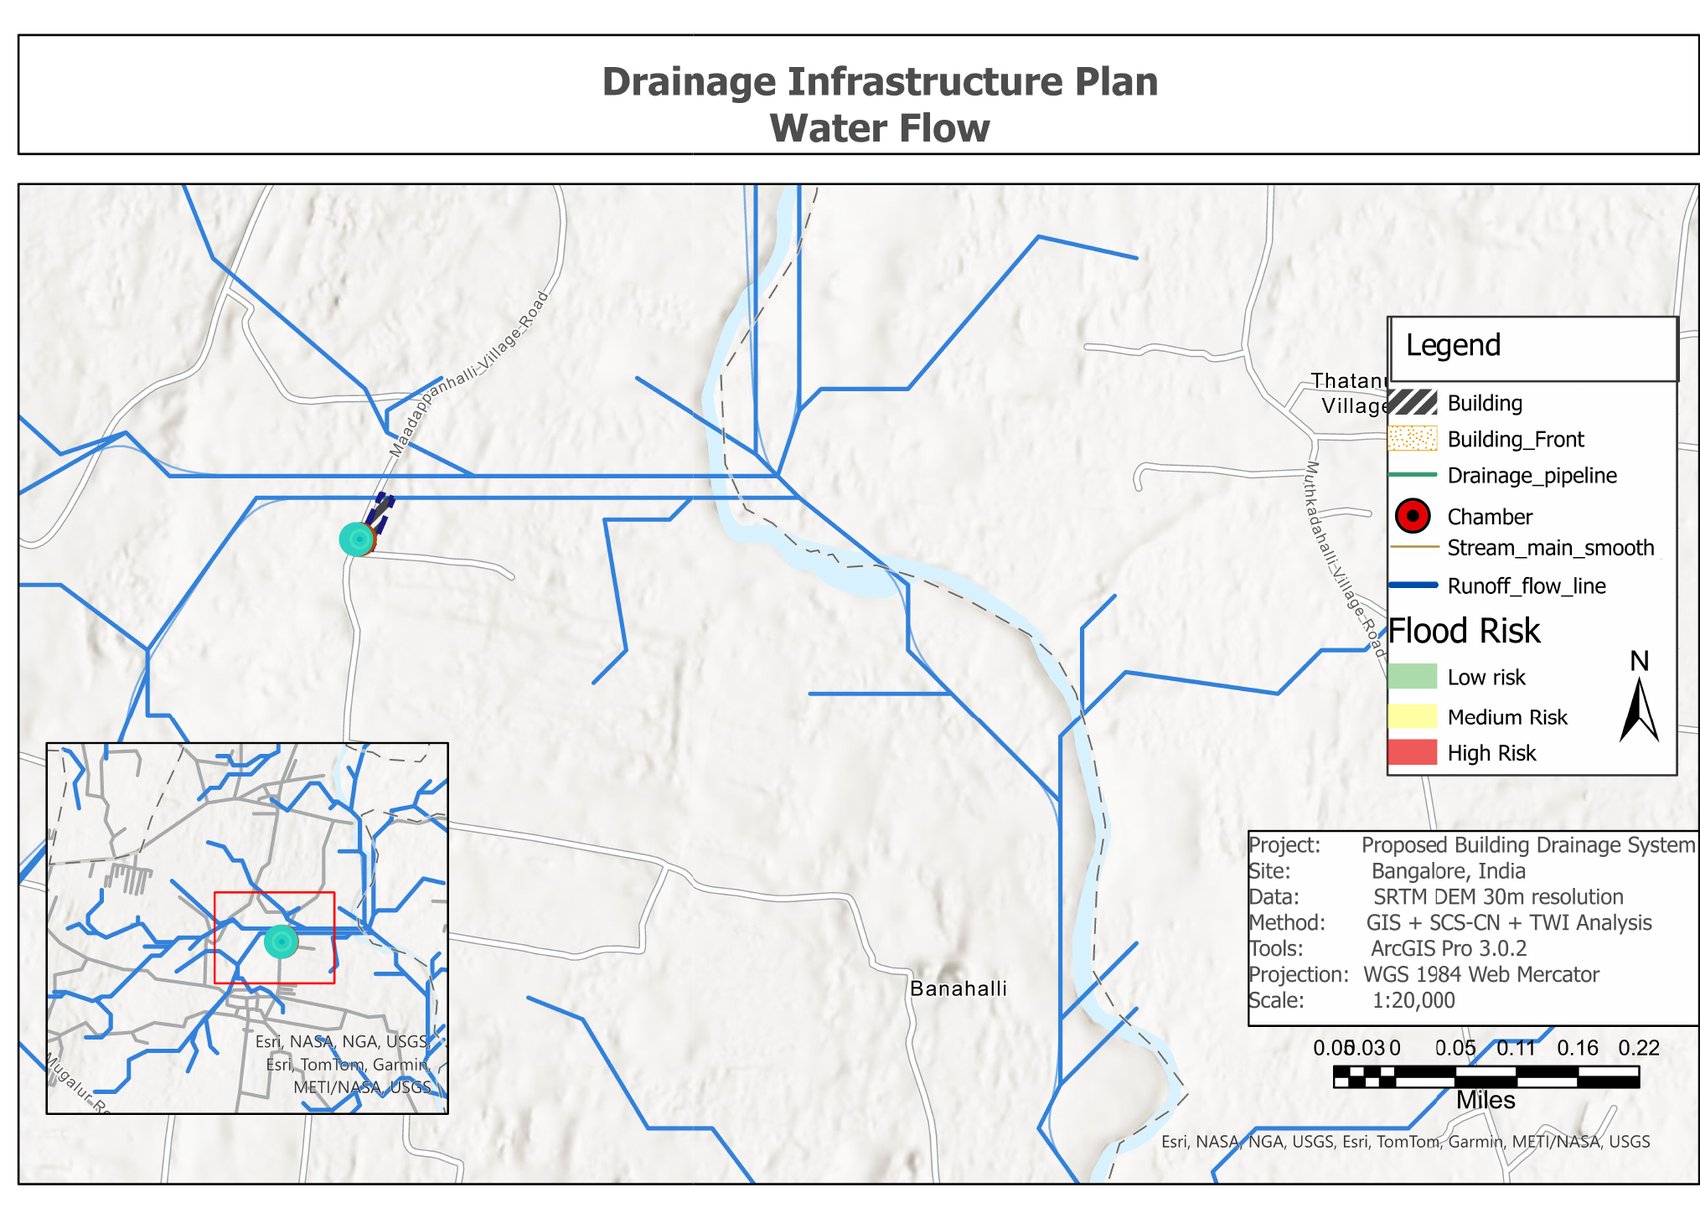
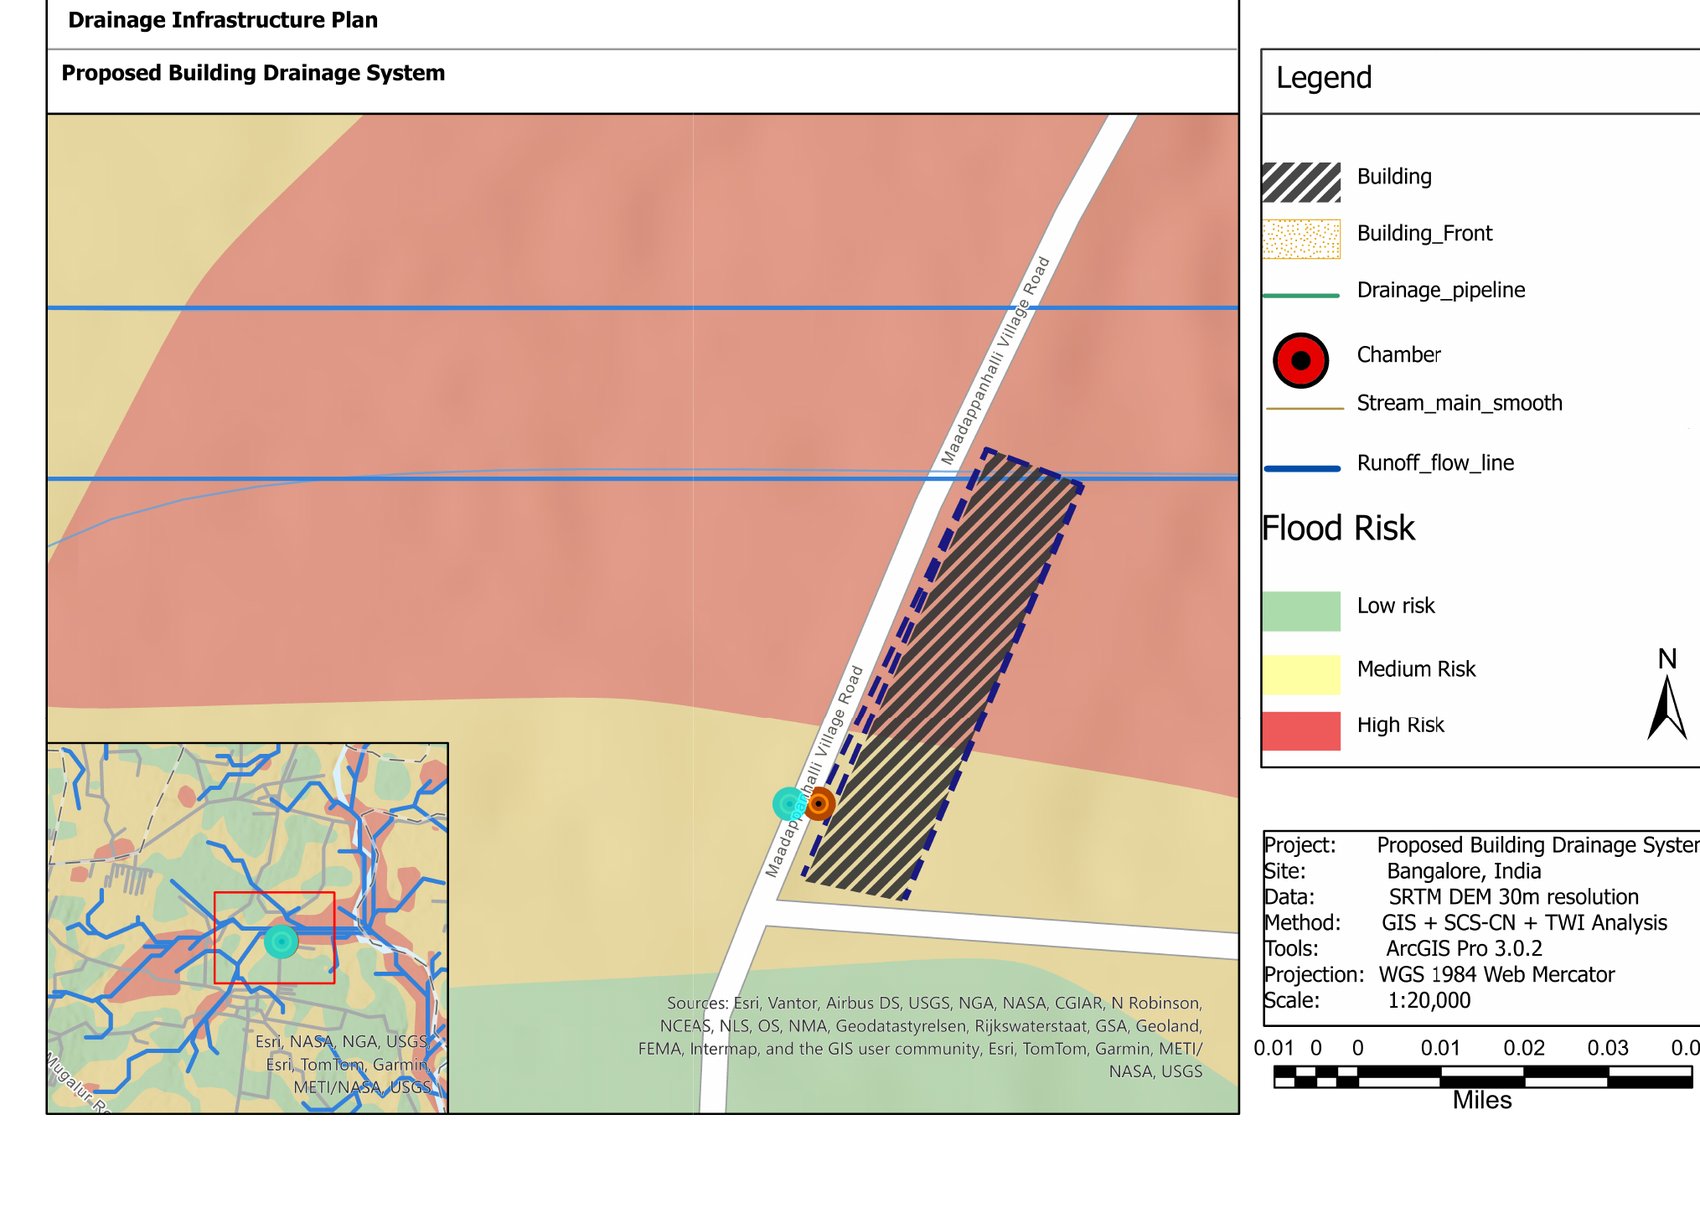
Flow direction and accumulation reveal the drainage lines the landscape already uses. The site sits close to a converging set of them — which is precisely why the flood risk classification matters here rather than being a formality.
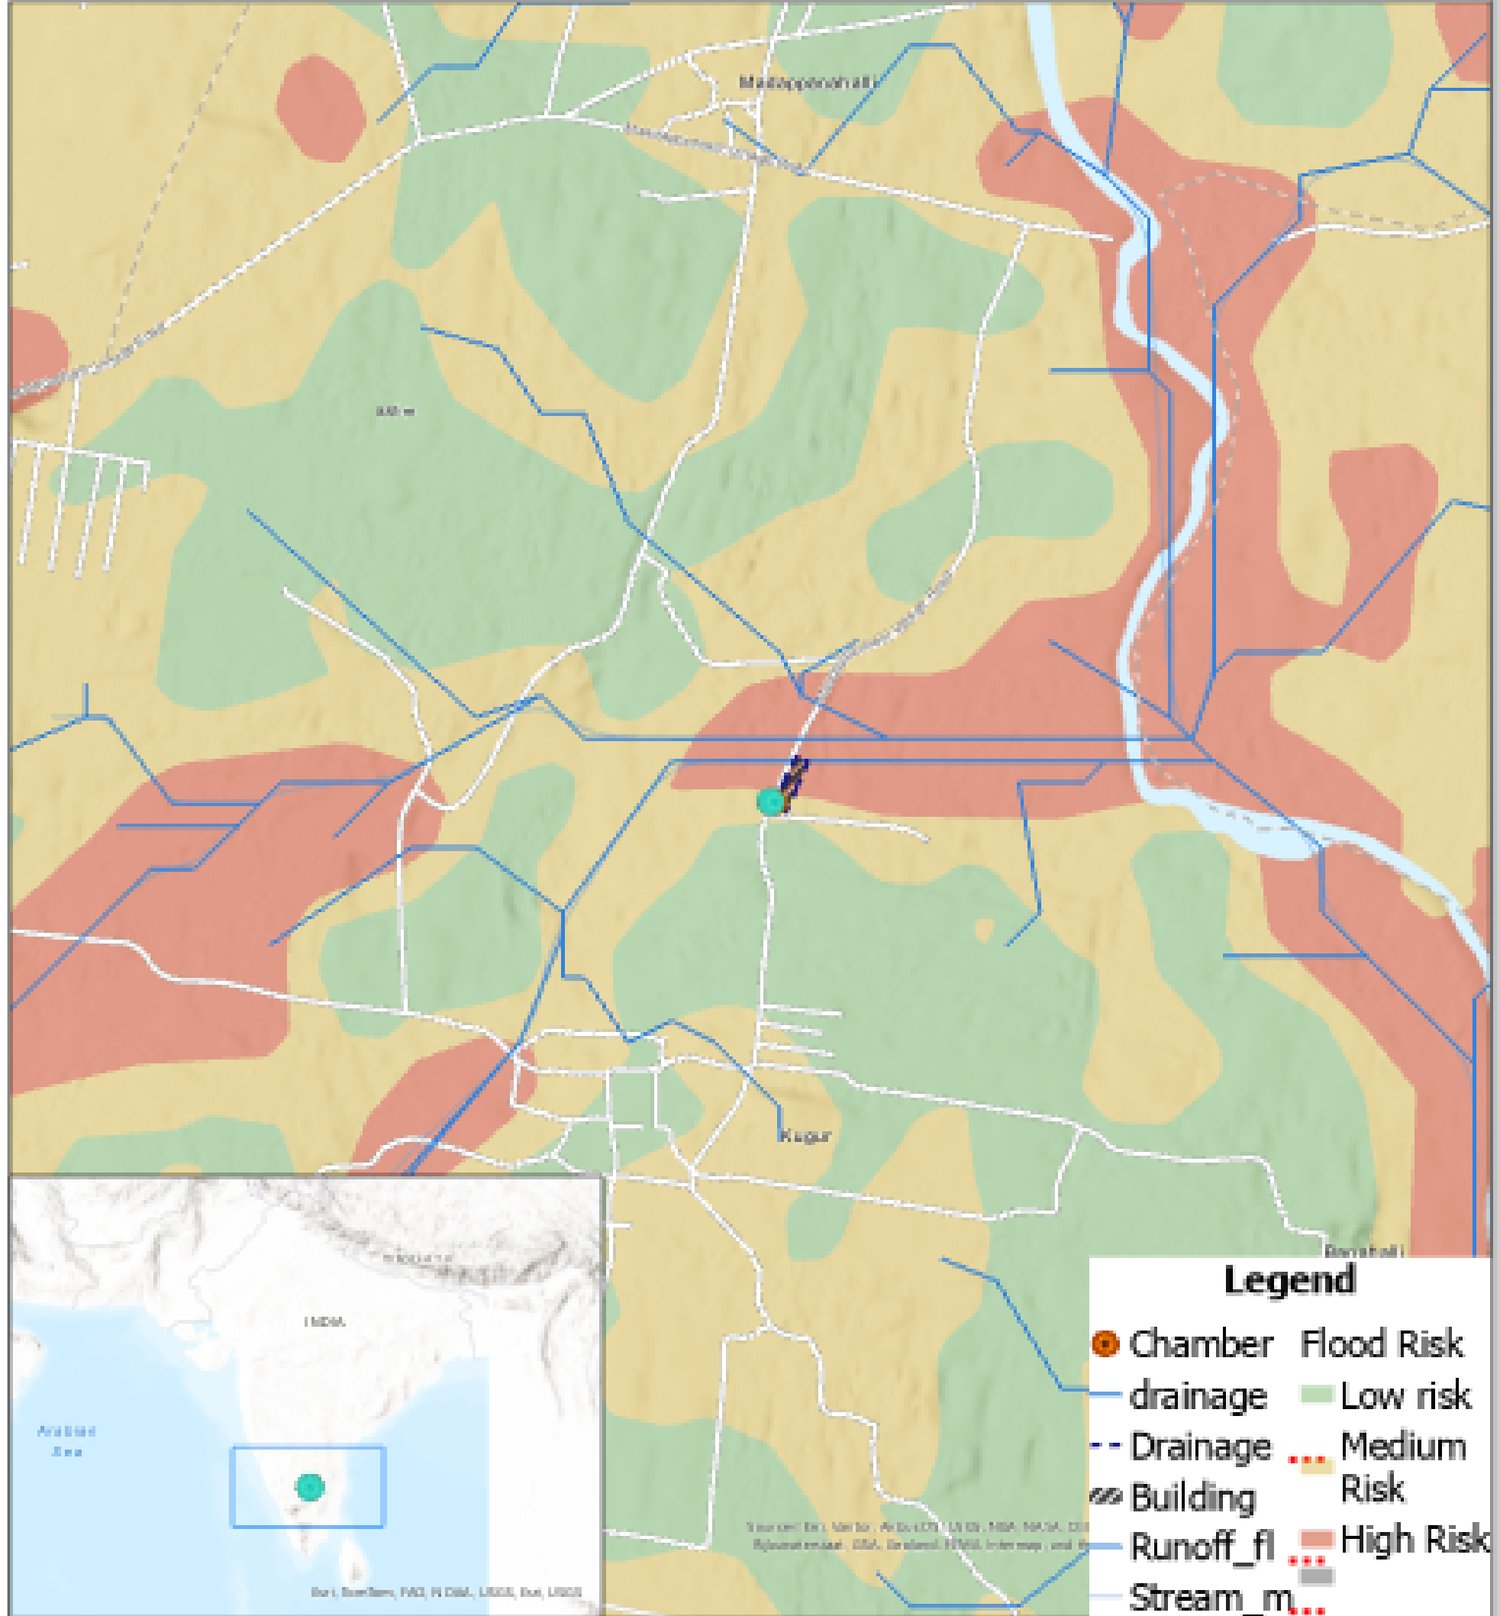
The building sits across a risk boundary
Classifying the study area into low, medium and high flood risk zones produced a result worth acting on: the proposed building is partially located in a medium-to-high flood risk zone.
Not entirely — and that partial exposure is the useful detail. The northern portion of the footprint falls in the high risk band while the southern end sits in medium. A single risk rating for the whole plot would have hidden that, and with it the reason the drainage has to run the way it does.
Risk at the building footprint
Drainage that follows the slope
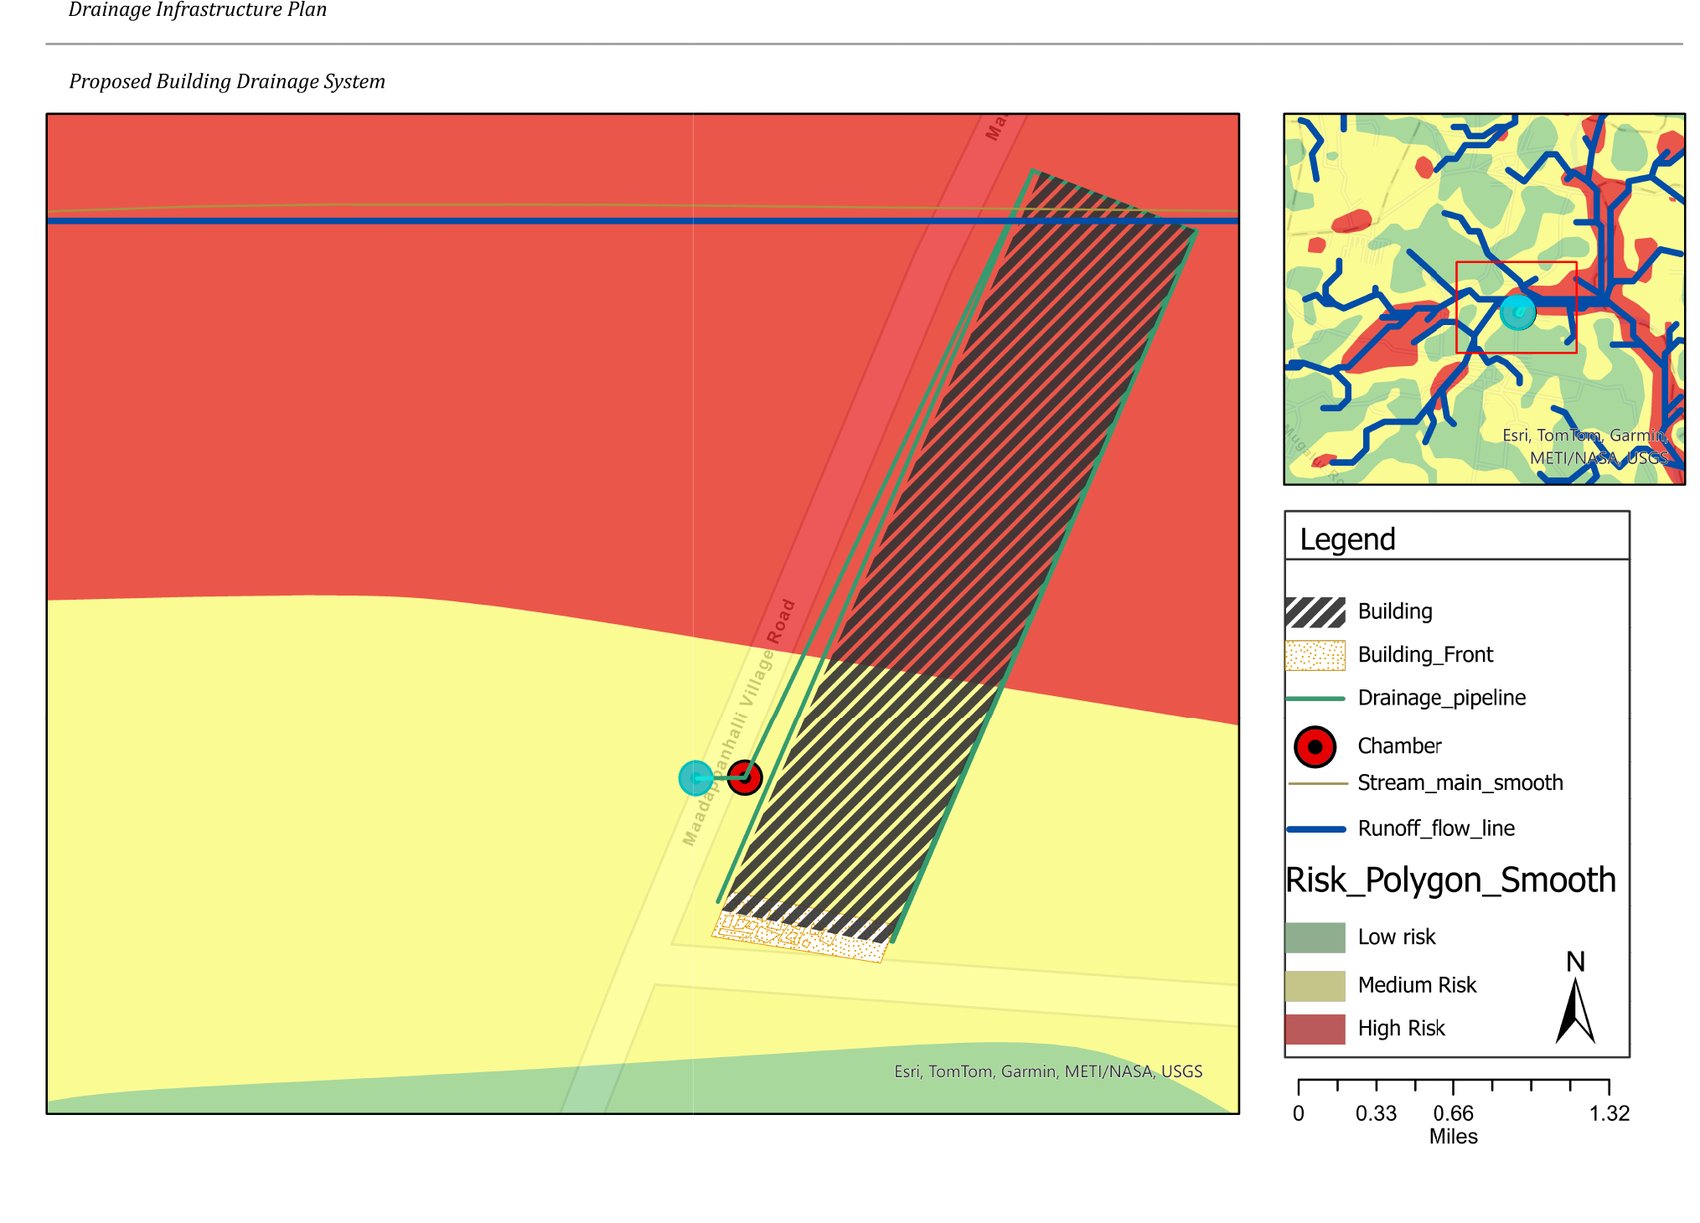
The proposed system works with the terrain rather than against it. Pipelines follow the site slope so runoff is collected and carried by gravity; inspection chambers regulate flow and allow maintenance; and the run discharges into the existing road drainage network rather than into the neighbouring low ground.
The practical outcome is that surface water is intercepted and moved away from the building envelope before it can pond against the structure.
What the project delivered
Drainage layout from natural flow
A layout derived from measured terrain behaviour rather than assumed, so the pipe runs match where water actually wants to travel.
Runoff directed away from the building
Surface water intercepted upslope and carried clear of the footprint, addressing the partial high-risk exposure the analysis identified.
Accumulation zones identified
High-accumulation pockets mapped explicitly so they could be managed in the design instead of discovered after the first monsoon.
A system meant to last
Gravity-fed, maintainable via chambers, discharging to existing infrastructure — low-intervention and sustainable over the building’s life.
Data & tools
Elevation data
SRTM DEM at 30 m resolution — terrain, slope and site topography
Analysis
ArcGIS Pro 3.0.2 with the Spatial Analyst extension — flow direction, flow accumulation and raster processing
Hydrological methods
SCS-CN runoff estimation and Topographic Wetness Index, combined into a three-band flood risk classification
Basemap & projection
Esri World Basemap · WGS 1984 Web Mercator · map scale 1:20,000
“Mapping is not just about data — it’s about understanding what the Earth is saying.”