GIS Projects

Maps that listen to the land

“Mapping is not just about data — it’s about understanding what the Earth is saying. My GIS work is where science meets soul.”

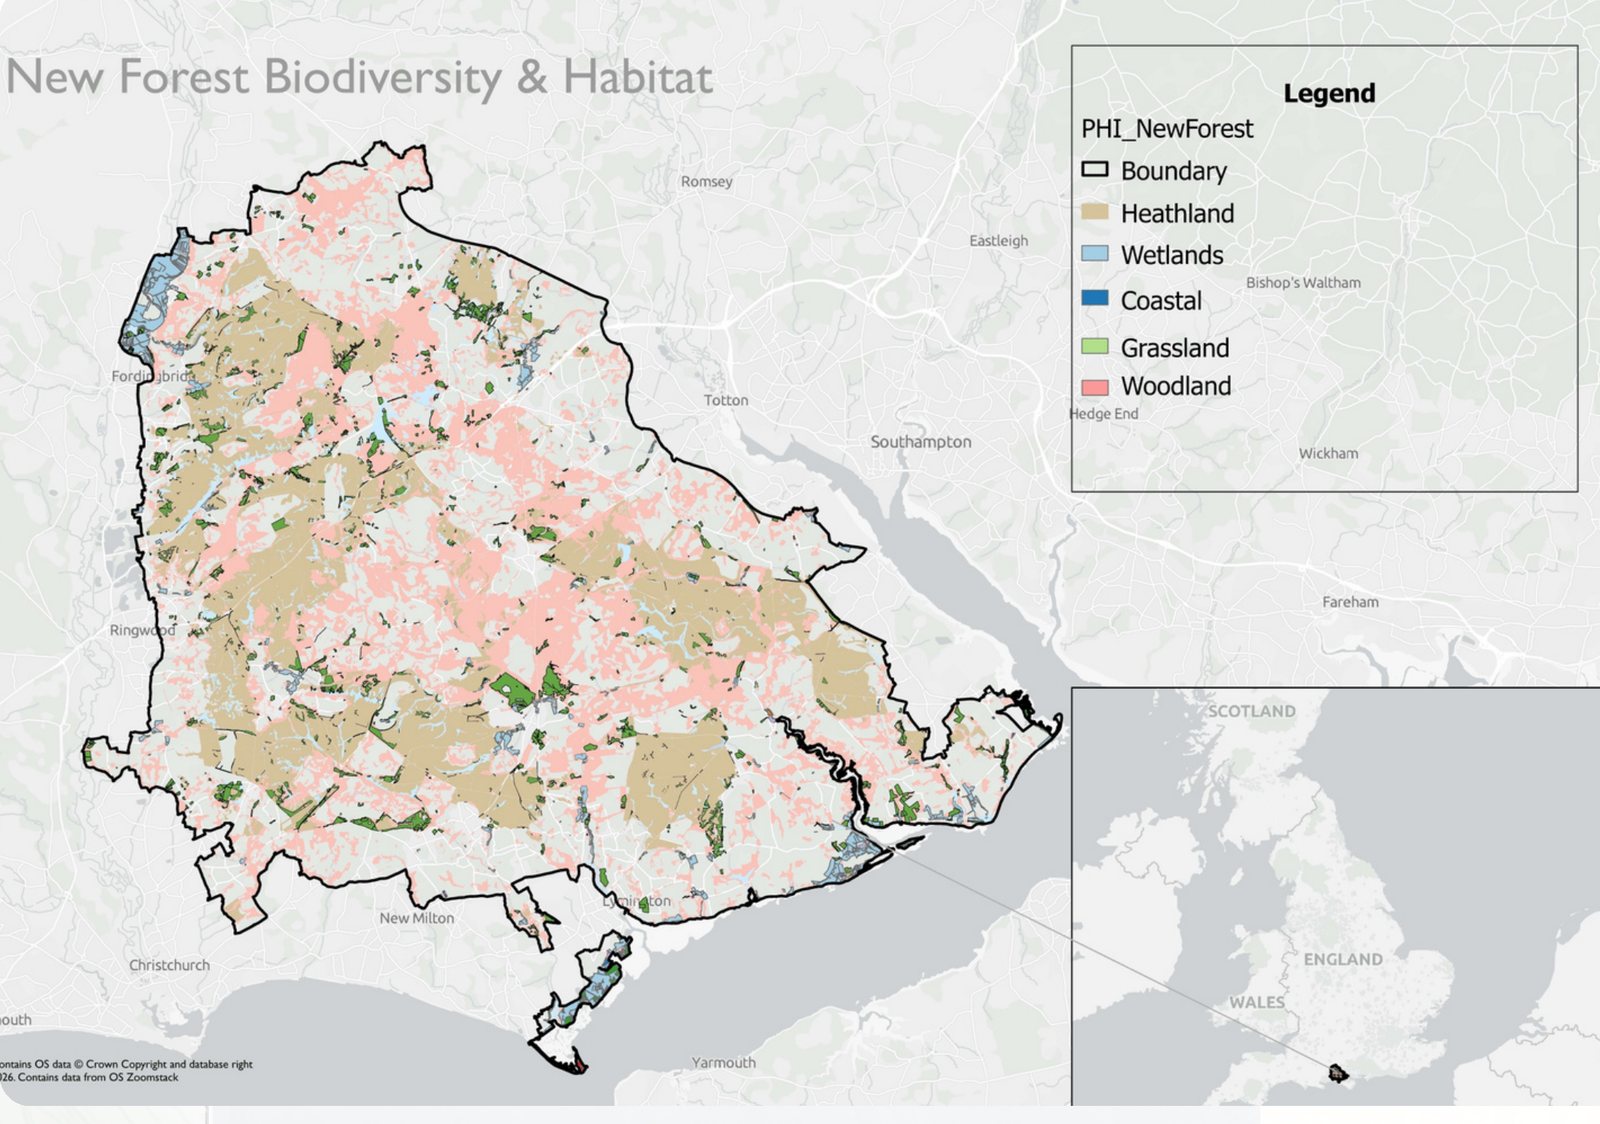
Habitat classification map of New Forest National Park showing heathland, woodland, wetland and grassland

United Kingdom · Design & Conservation

Beyond the Trail — Eco Trail Design & Biodiversity Mapping

An eco-sensitive trail system for the New Forest, built on GIS ecological analysis. I classified habitats across the whole park, derived slope from a DEM, mapped species records into a biodiversity index, and ran 50 m buffer analysis along three eco-trails — Emery Down Circular, Rhinefield and Burley Village.

The analysis then became something people can actually use on the trail: an interactive Leaflet web app with habitat layers, species observations and a biodiversity index per route.

Tools & methods: ArcGIS Pro, QGIS, Leaflet, British National Grid (EPSG:27700), habitat classification (PHI/Natural England), slope analysis (USGS DEM), species data (NBN Atlas/iNaturalist), 50 m trail buffer analysis.
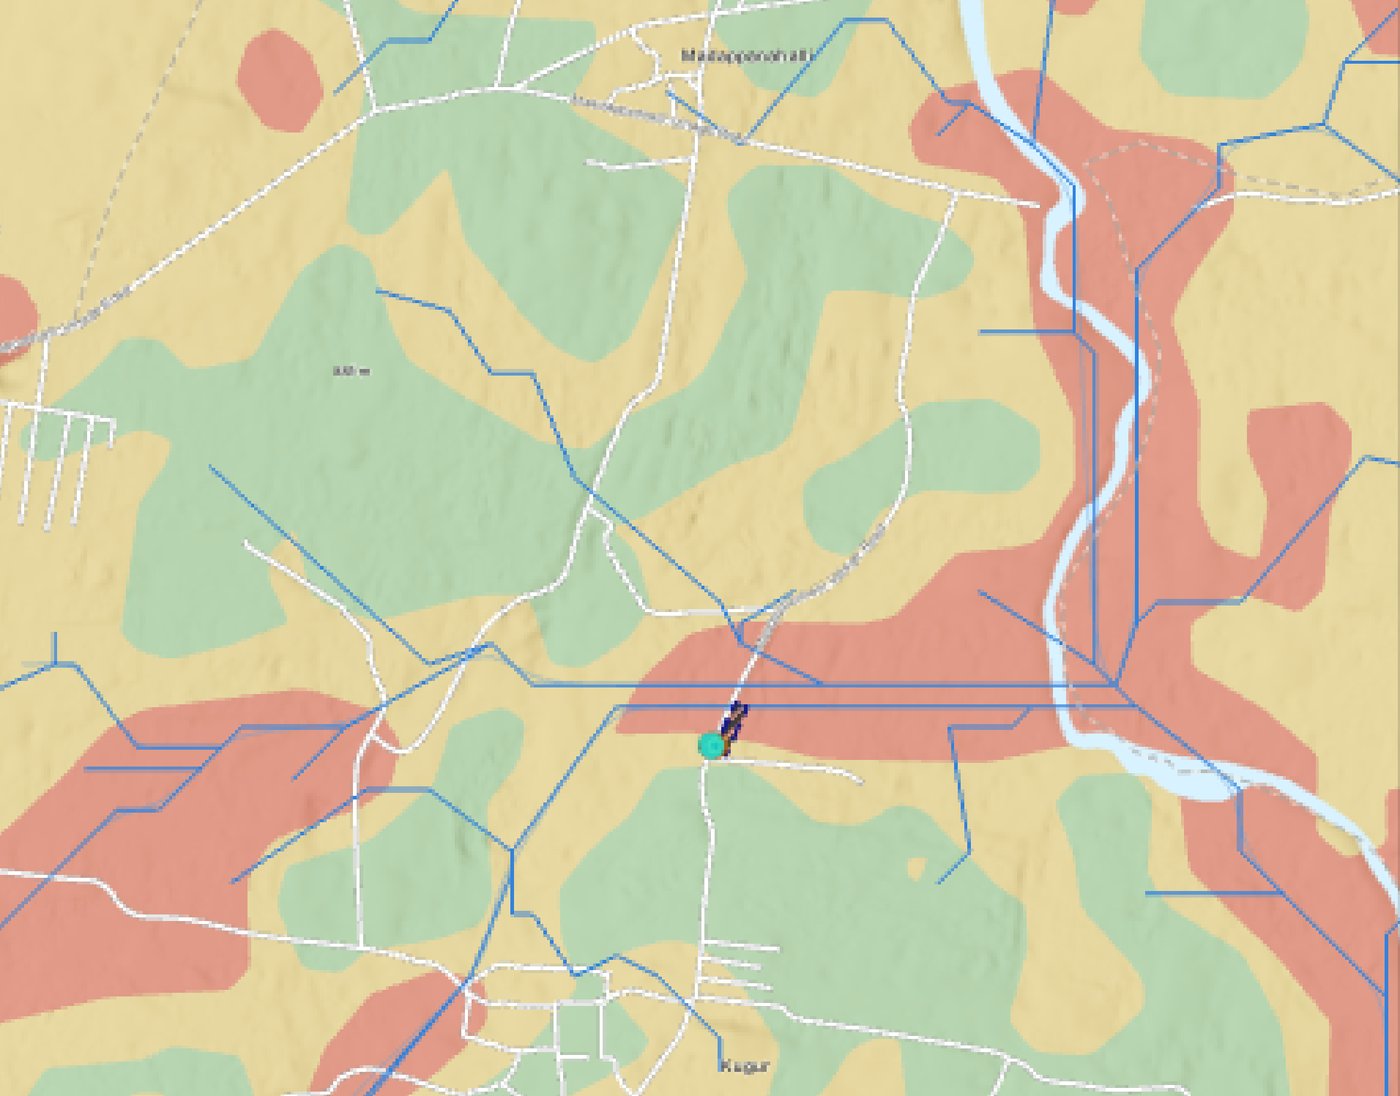
Flood risk classification map around the proposed warehouse site near Bangalore

Bangalore, India · Hydrology & Infrastructure

Warehouse Drainage & Flood Risk Analysis

A pre-construction drainage assessment for a proposed warehouse near Bangalore. I modelled terrain from 30 m SRTM elevation data, estimated runoff with SCS-CN, and applied the Topographic Wetness Index to classify the site into low, medium and high flood risk zones.

The analysis found the building footprint partially inside a medium-to-high risk zone — so the proposed drainage follows the natural slope, uses inspection chambers to regulate flow, and discharges into the road network away from the structure.

Tools & methods: ArcGIS Pro 3.0.2, Spatial Analyst, SRTM DEM (30 m), SCS-CN runoff estimation, Topographic Wetness Index, flow direction and accumulation, WGS 1984 Web Mercator, 1:20,000.

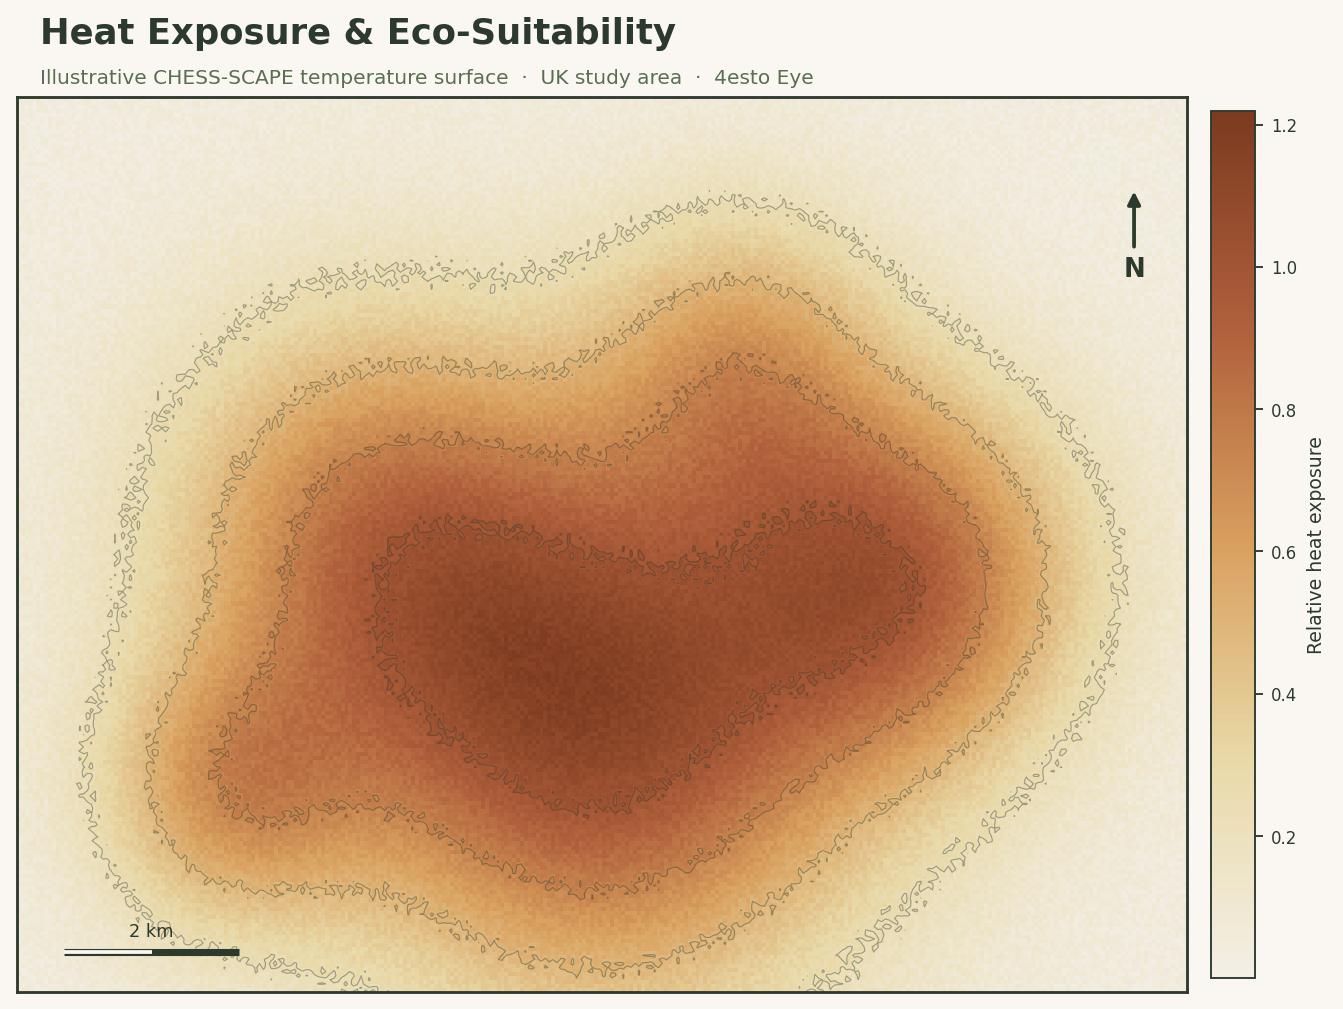
Heat exposure map of the UK

United Kingdom · Climate

Heat Exposure & Environmental Suitability

Analyses temperature exposure patterns using high-resolution climate data (CHESS-SCAPE) to understand environmental stress. Produces eco-suitability maps that identify areas more or less suitable for outdoor activity under increasing heat conditions.

Tools & methods: CHESS-SCAPE climate data, heat mapping, spatial statistics, eco-suitability analysis, GIS modelling.

Street-level map of Mannady, Chennai

Chennai, India · Community

Street-Level Mapping — Mannady

Created a detailed street-level map of the Mannady area with ActionAid. Digitised roads, lanes, and local features to support community planning. This work strengthened my interest in people-centred GIS, where maps directly support local needs.

Tools & methods: QGIS, detailed vector mapping, spatial data cleaning, map production.

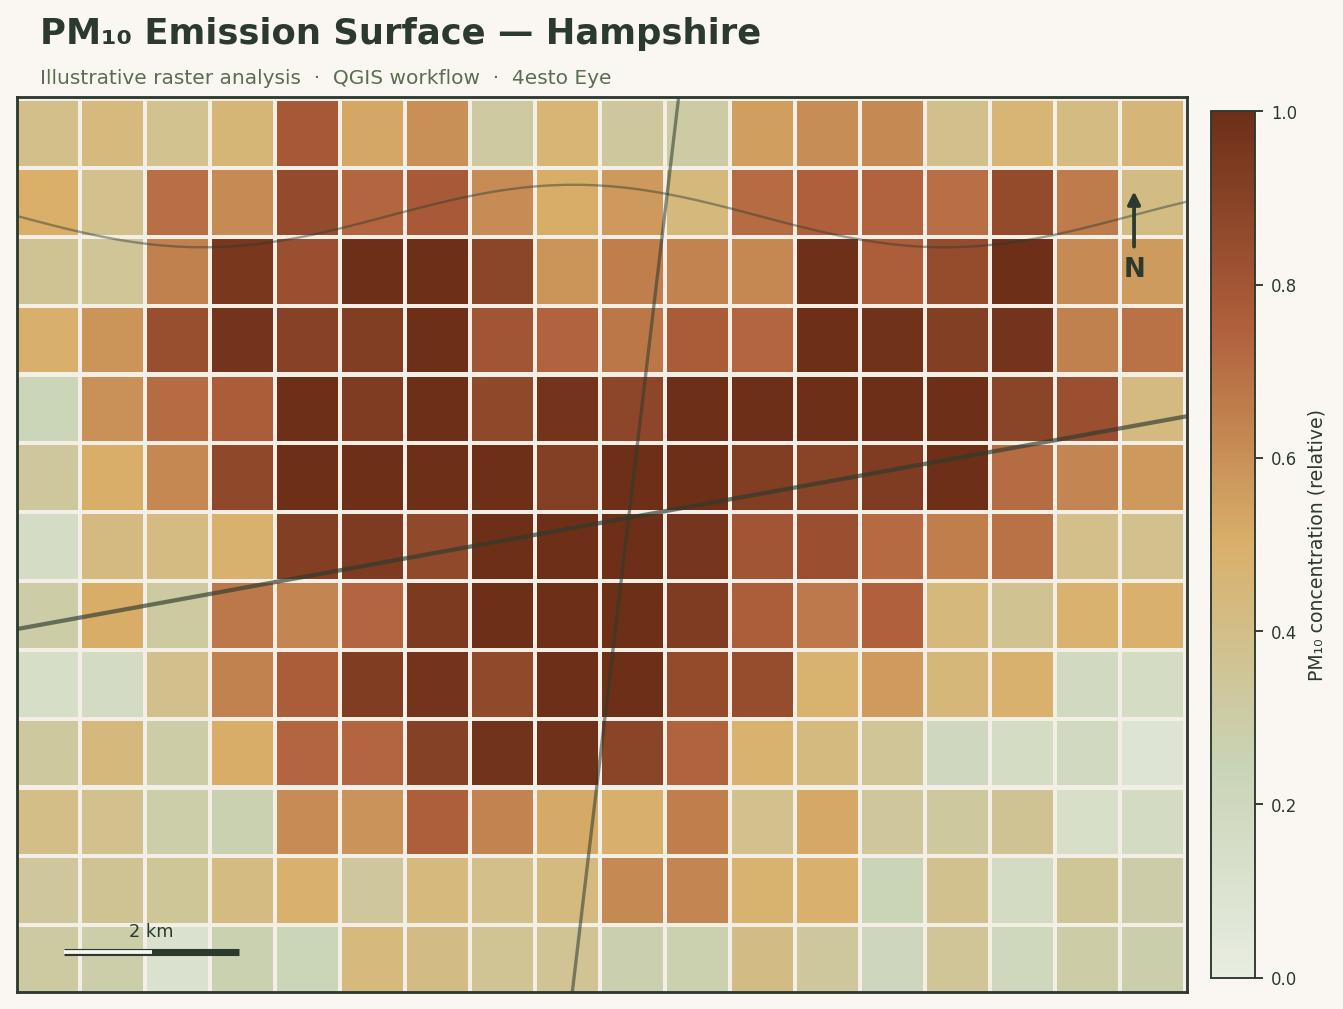
PM10 air quality map of Hampshire

Hampshire · Health

Emission & Air Quality Mapping

Analysed PM10 air pollution levels to understand spatial patterns of emissions. Visualised pollution distribution and explored relationships between land use and environmental quality — making invisible environmental problems visible.

Tools & methods: QGIS, raster analysis, environmental datasets, spatial visualisation.

“Maps can tell stories, and nature can teach — if we take the time to observe.”

Interested in working together? Get in touch →