Beyond the Trail
“People do not just walk through nature — but understand and connect with it. The map becomes a guide to understanding nature.”
Using GIS to connect people with nature. I mapped habitats, terrain and biodiversity across three New Forest eco-trails, then built the results into an interactive web app anyone can open on their phone while they walk.
-
SA
New Forest National Park, Hampshire British National Grid (EPSG:27700)
-
SW
ArcGIS Pro, QGIS, Leaflet Desktop analysis through to a published web map
-
3
Three eco-trails analysed Emery Down Circular, Rhinefield, Burley Village
A walk, or an environmental experience?
While trekking through the New Forest I kept running into the same frustration: I couldn’t tell what I was looking at. Which habitat was I standing in? What lived here? Why did this stretch feel different from the last?
The information existed — but scattered across separate apps and datasets, none of them talking to each other, none of them available at the moment you’re actually standing on the trail. Without it, a nature walk stays “just a walk” rather than something you learn from.
So the question became: could GIS bring environmental information into one simple, understandable system?
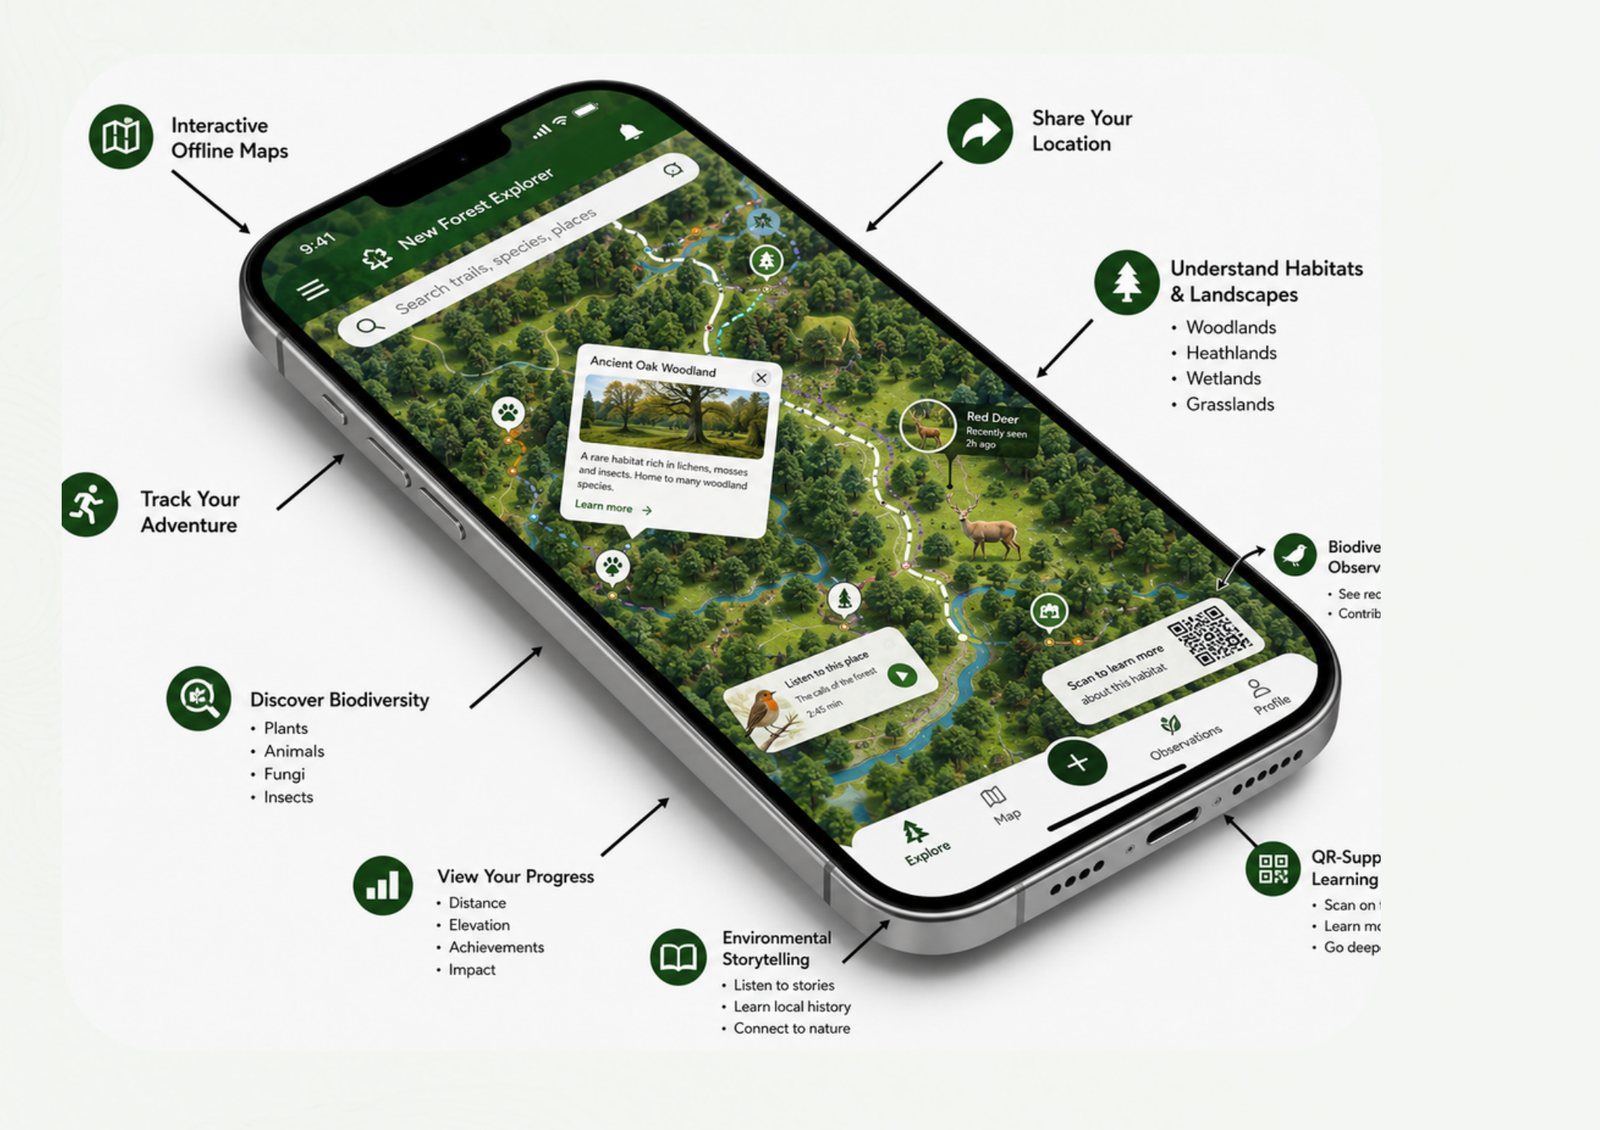
Five-stage GIS workflow
Habitat & terrain
Habitat zones classified from Priority Habitat Inventory data (Natural England), with study area defined from Ordnance Survey boundaries. Slope derived from USGS DEM to assess walking conditions and accessibility.
Biodiversity & trails
Bird, fungi and plant records from the NBN Atlas spatially filtered to the eco-trails, then a 50 m buffer applied along each route from AllTrails and OpenStreetMap trail data.
Web map
Analysis published as a public Leaflet web app — interactive trail map, toggleable habitat layers, and species observations tied to location.
What the park is actually made of
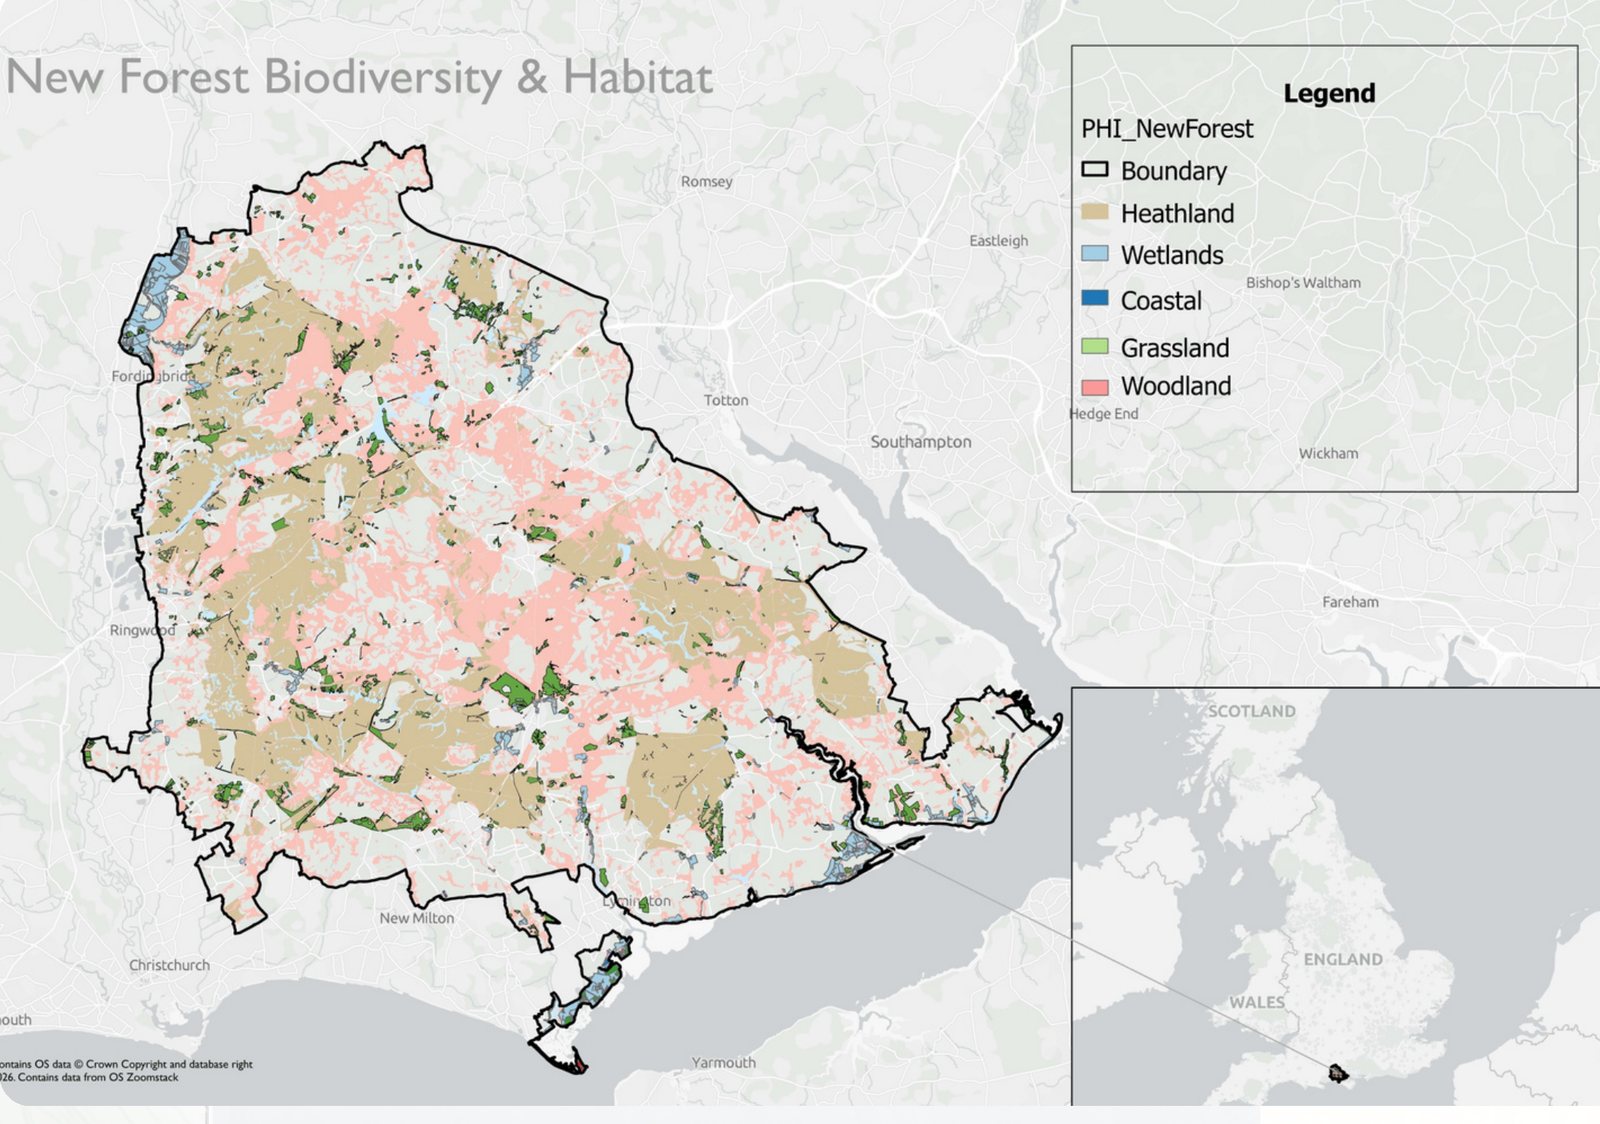
Classifying the whole park first made the trail-level picture meaningful. Four habitat types recur along the routes — woodland, heathland, wetland/fen and grassland — and the spatial variation between them is what gives each trail its character.
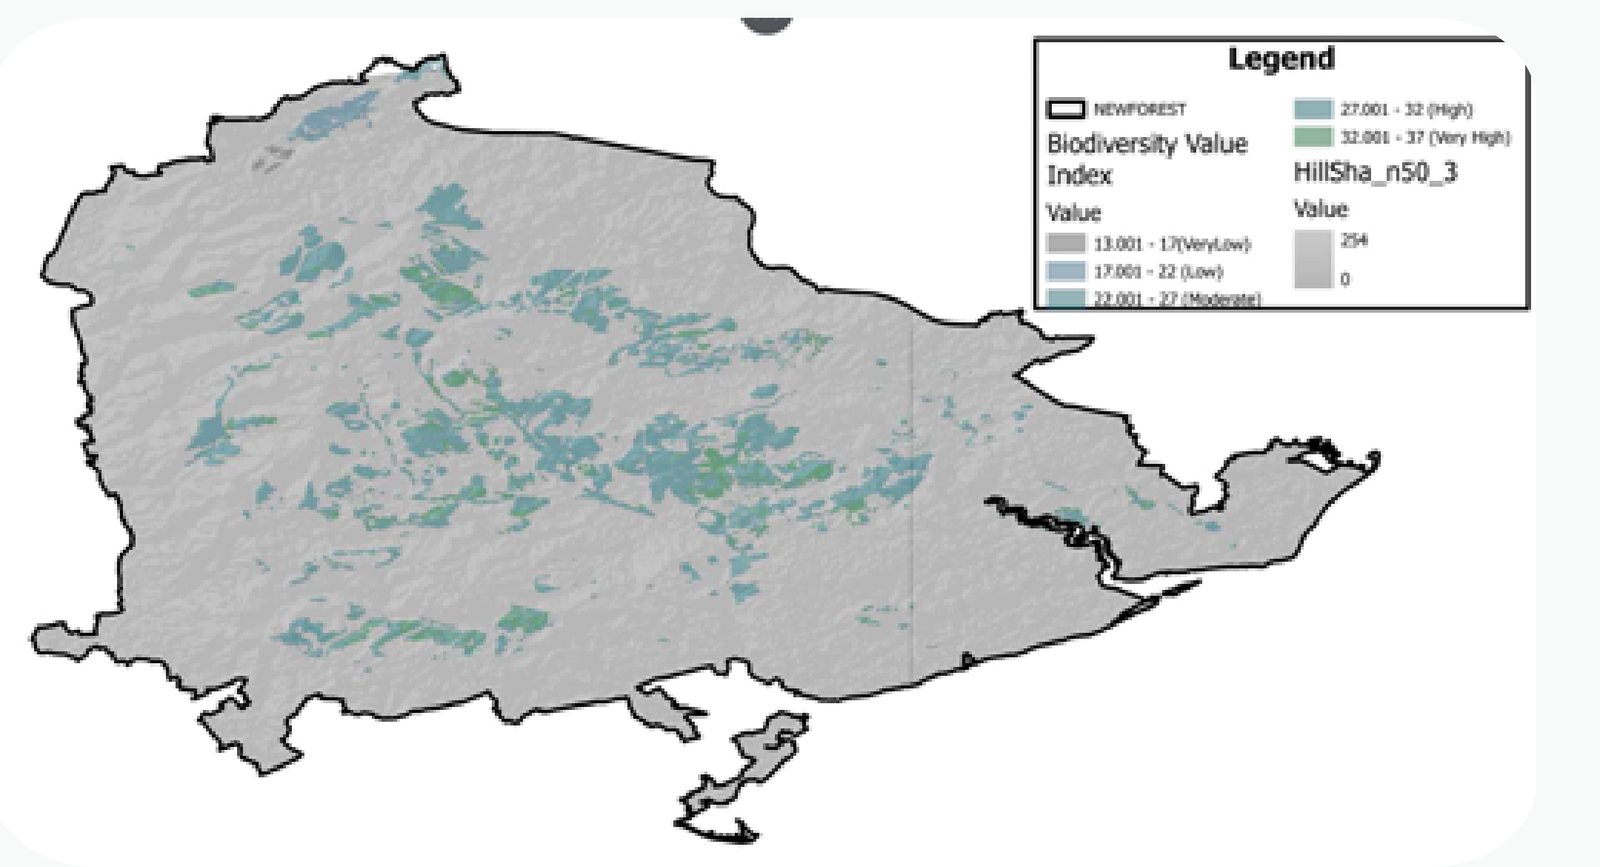
Where the richness actually sits
Species records were classified into a Biodiversity Value Index and mapped across the park. The result is not evenly spread — biodiversity concentrates in identifiable ecological zones rather than following the trails or the pretty views.
That distinction matters for planning. It means an eco-trail can be routed to pass close to ecologically rich areas for learning value, while keeping walkers out of the most sensitive ones.
Three trails, three ecological signatures
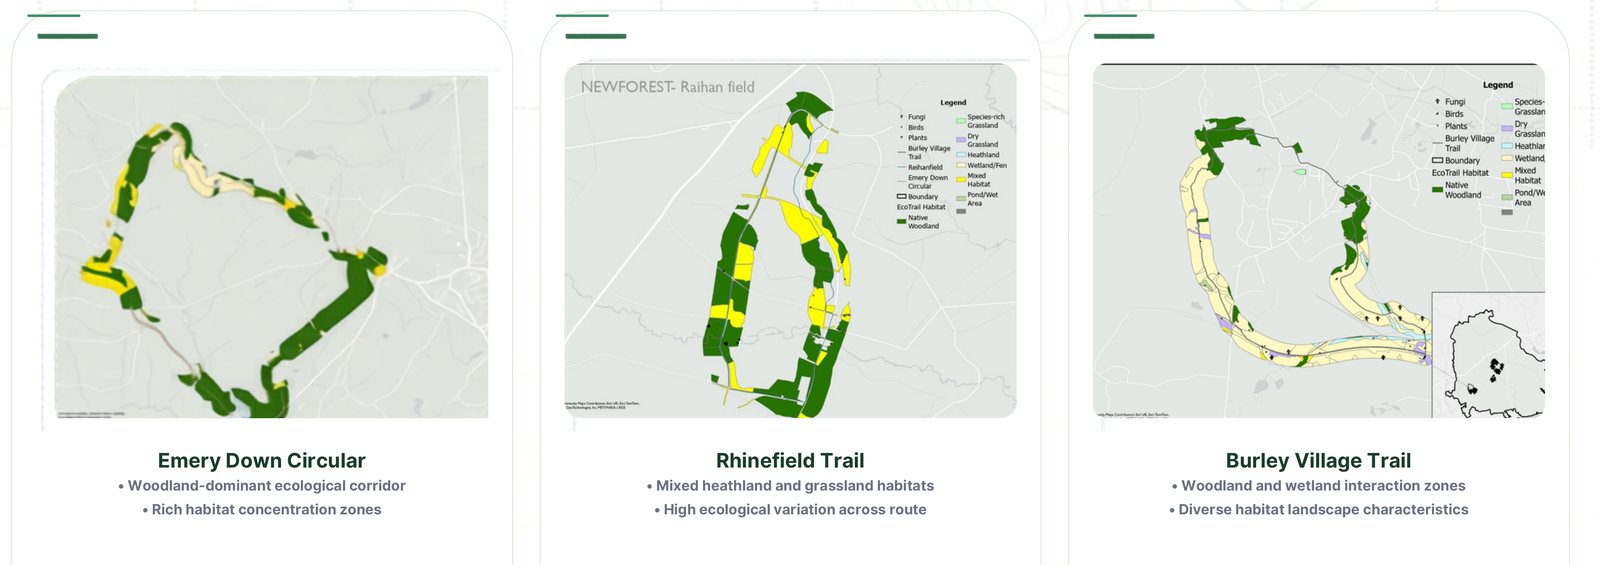
Emery Down Circular
A woodland-dominant ecological corridor, with rich habitat concentration along most of its length.
Rhinefield Trail
Mixed heathland and grassland, showing the highest ecological variation across a single route.
Burley Village Trail
Woodland and wetland interaction zones — the most varied habitat landscape of the three.
Species patterns followed habitat rather than trail popularity: fungi concentrated in shaded woodland, plant diversity tracked habitat type, and bird observations clustered where the surrounding ecology supported them.
From ArcGIS to something you can actually use
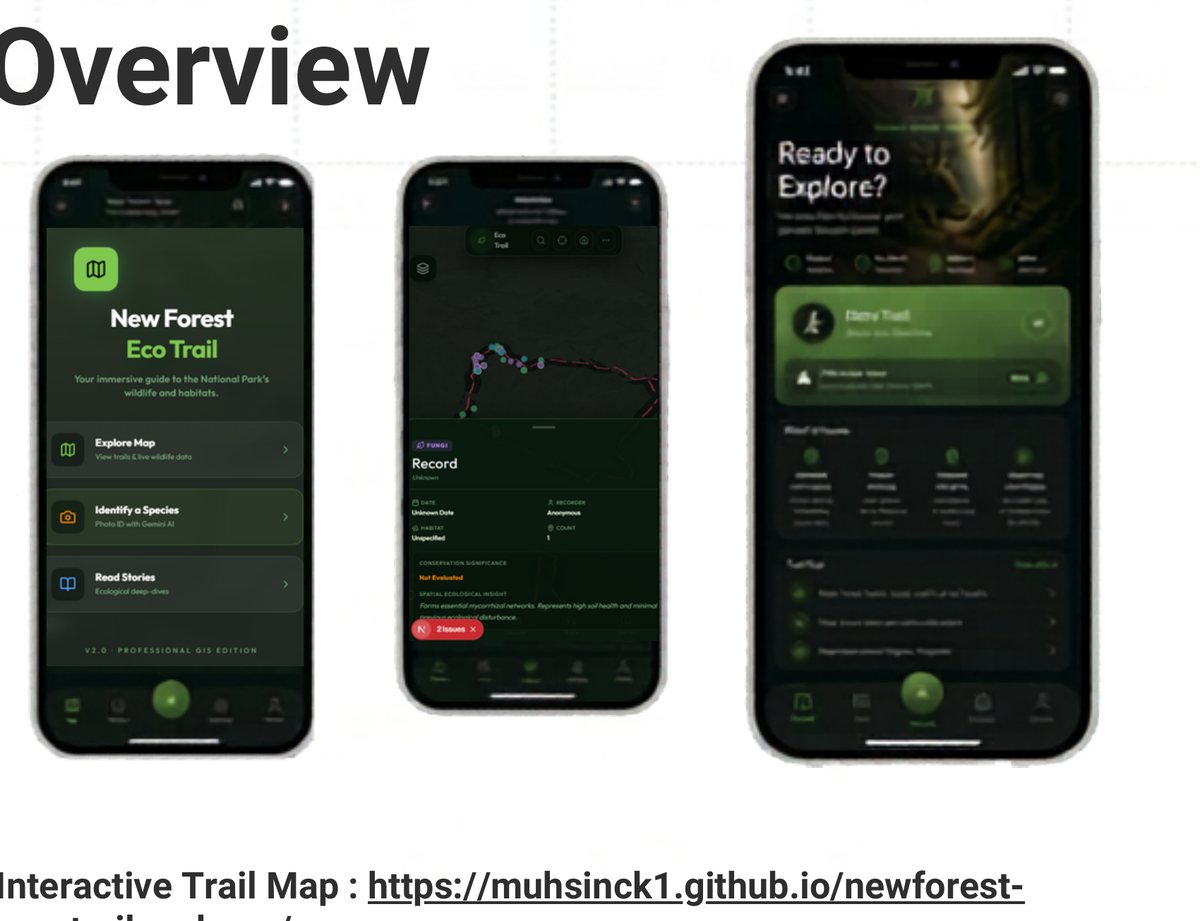
Desktop GIS answers the question, but it doesn’t reach the person standing in the wood. So the analysis was published as a Leaflet web app — an interactive trail map with habitat layers you can toggle, species observations tied to location, and a biodiversity index for each route.
It runs in a phone browser, no install. Built with HTML, CSS and JavaScript over Leaflet, with the spatial work done in QGIS and ArcGIS Pro.
What went in
Habitat
Priority Habitat Inventory (PHI) / Natural England · UKCEH land cover
Boundary
Ordnance Survey — study area definition, OS Zoomstack basemap
Trails
AllTrails and OpenStreetMap — route geometry for buffer analysis
Species
NBN Atlas and iNaturalist — bird, fungi and plant observation records
Terrain
USGS DEM — elevation model for slope and accessibility analysis
Future scope
Integrated biodiversity platform
iNaturalist API integration for richer species information and live ecological datasets.
Citizen science
Let visitors contribute their own wildlife sightings, turning walkers into recorders.
Scaling out
Extending the approach to more New Forest trails and other protected landscapes.
Project takeaway
GIS can support biodiversity-focused planning, identify ecologically rich trail routes, and improve public engagement with nature — supporting eco-trail planning, habitat management, biodiversity net gain and countryside access decisions, while helping visitors and students connect with what’s actually around them.
“Mapping is not just about data — it’s about understanding what the Earth is saying.”